BTCManager’s Weekly Cryptocurrency Outlook highlights the price action and technical indicators on a long-term basis to identify the best opportunities in the largest cryptocurrencies, such as bitcoin, ether, and others.
BTC-USD (Bitstamp)
The daily price action of BTC-USD is shown below. On January 3, the market closed above the Alligator, giving a buy signal. However, the rally was cut short at $17,234.99 and has since tested the support provided by the Alligator at $14,736.91, $14,499.95 and $14,341.57. If the daily close remains above the Alligator indicator, we should see the upward trend continue.
Notice the most recent buy fractal lies at $12,050.00 and a sell position is only justified with a move below this fractal support; in this case, we should target the recent low near $11,000. Also, a daily close below the Alligator will give a bearish signal and short positions are suggested in this case. On the other hand, we see that a fractal resistance is forming at $17,234.99. A break above this level should open up the $20,000 handle.
BTC-USD (Daily, Bitstamp)
The weekly price action is displayed below and shows that for the first time since October 2017, the Awesome Oscillator has changed color to red. Therefore, this indicates that bullish momentum is weakening and that the market may re-test the 50 percent Fibonacci level at $11,319.01. Immediate support lies at $13,288.90 while resistance is seen at $15,726.22.
BTC-USD (Weekly, Bitstamp)
When using the Ichimoku indicator, the key levels to watch for the week ahead are at $13,880 and $16,124. A weekly close higher than $16,124 should open up the all-time high at $19,666 whereas a weekly close below $13,880 will point to further downside over the long term. A weekly close between these two levels will be considered neutral.
BTC-USD (Weekly, Bitstamp)
ETH-USD (Kraken)
As BTCManager reported on January 2, we anticipated ether to drift toward the $1050.69 Fibonacci extension level after making strong gains above $650. The altcoin reached a fresh all-time high of $1191.00 on January 8. The daily chart is shown below for ETH-USD.
Since triggering the bullish saucer on January 3, the price of ether has moved higher by just $300, currently resting at $1145.99. The resistance at $1050.69 now turns into support. The bullish momentum in the market is suggested to be strong, with the upward trending conversion line telling us that the market is likely to continue higher.
Applying the Fibonacci indicator for the most recent Elliot wave (a movement with a high and a low with no fractal in between them), we see that the market is retreating from the second extension level at $1178.23, suggesting the market will now head to the support provided at $923.75, if $1050.69 is broken. Resistance further up is seen at $1432.71, aligning with the Fibonacci resistance given by the weekly timeframe.
ETH-USD (Daily, Kraken)
The weekly price action is displayed below and shows the last week’s candlestick is an imperfect bullish Marubozu; therefore we look to set limit buy orders near the 50 percent level and open of this candlestick (at $921.20 and $744.39 respectively). Ether could fall to around $744.39 and still remain in an uptrend.
ETH-USD (Weekly, Kraken)
The next resistance suggested by the Fibonacci extension levels is at $1449.76, since we observed a weekly close above the 261.8 percent extension level at $1050.69.
BCH-BTC (Bittrex)
Bitcoin cash looks to decline further against bitcoin this week. The conversion line (blue) has moved lower sharply, now providing resistance at 0.1804, just above the the current market price of around 0.1500.
The weekly price action below shows that the market is likely to tend toward support at 0.0856, the trough of the lagging line. Moreover, fractal support lies at 0.068 and the market has a greater likelihood of testing this support because the fractal resistance has just formed on this week’s open at 0.2927.
The bearish outlook is only invalidated if there is a weekly close above the conversion line. We also see that volume has declined since the announcement of Coinbase’s integration of bitcoin cash, suggesting a further decline.
BCH-BTC (Weekly, Bittrex)
On the daily timeframe, the price is at equilibrium since the market is within the Ichimoku cloud. Therefore, it is possible that a breakout to either side is possible, however, there is more bias to the downside; firstly, the base line (red) remains above the conversion line (blue) suggesting bearish momentum dominates.
BCH-BTC (Daily, Bittrex)
Moreover, we see that the Awesome Oscillator is moving lower and red in color. A bearish signal will soon be given, as the oscillator looks to dip into the negative zone for the first time since early December.
LTC-USD (Bitfinex)
The weekly price action below shows that LTC-USD is just above an important support level at $229.04. We suggest limit buy orders near $229.04 and $144.58, the 50 percent and open levels of the bullish Marubozu formed a few weeks back.
LTC-USD (Weekly, Bitfinex)
The Fibonacci levels show that the next resistance is at $294.845 and the all-time high at $370.78. If there is upward trend continuation, we could witness a long-term drift toward the Fibonacci extension level at $569.62. Immediate support is seen at $247.86. Since the market has tested the 38.2 percent retracement level already in mid-December, we have a bullish bias and look for a break of the Fibonacci resistances to buy or a test of the support provided by the bullish Marubozu candlestick.
XRP-USD (Bittrex)
The author received a lot of requests about ripple; should they buy? The crypto mania is gaining more attention as ripple ascends to new heights, but is the altcoin standing on its last legs? The daily chart for ripple is shown below and provides a bearish outlook for the altcoin.
XRP-USD (Daily, Bittrex)
The market has moved below the trough of the lagging line (purple) giving an indication of downward momentum. The price of ripple has touched lows near $2.00 on January 8 and a daily close below $2.4966 will open up the fractal supports at $1.98 and $0.62.
Also, we see that momentum is shifting in favor of sellers, with the Awesome Oscillator changing color on January 8 from green to red. Furthermore, we look to realize a daily close below the conversion line (blue) which will give another, although weak, bearish signal.
ADA-BTC (Bittrex)
Cardano’s cryptocurrency looks overstretched, and only managed to close just about in the second third of the price action last week. The long upper wick suggests buyers are weakening and we are likely to see a return to short-term equilibrium, as given by the conversion line, which stands at 0.00004771.
ADA-BTC (Weekly, Bittrex)
XMR-BTC (Poloniex)
The daily chart below for XMR-BTC shows that monero may make a bullish breakout against bitcoin. Firstly, notice that the open and 50 percent level of the bullish Marubozu formed on December 20, 2017, have both held up as support. Also, the market tested the 38.2 percent retracement level on January 6 and has since bounced higher, suggesting we will see uptrend continuation and an attempt at the recent high at 0.0289.
XMR-BTC (Daily, Poloniex)
The Ichimoku indicator tells us the market closed above the conversion line on January 7, giving a strong bullish signal. Alternatively, we can buy on a break of the most recent fractal resistance at 0.0269.
XMR-BTC (Daily, Poloniex)
The weekly price action for XMR-USD is shown below, with last week’s close higher than the key resistance at $374.09. This opens up an attempt at the Fibonacci extension level at $506.47. The market tried to attempt this level in December but only managed to get as high as $469.50.
XMR-USD (Weekly, Kraken)
Also, another bullish indication is given by the conversion line, where the gradient has noticeably increased for the current week. Furthermore, the Ichimoku cloud has finally formed for the price action on the Kraken exchange, which suggests the upward trend will remain intact and serves as a good sign for bull/buyers.
DASH-USD (Bitfinex)
The weekly price action for DASH suggests a slight bullish bias, given that the conversion line (blue) has moved higher this week. Therefore, we look to buy around the conversion line, that is just above the $1000 handle at $1006.22; we keep the trade open as long as the weekly close is higher than the conversion line, which will suggest more upside to come. However, a weekly close below the conversion will give a bearish outlook.
DASH-USD (Weekly, Kraken)
DCR-BTC (Poloniex)
Decred looks to continue to head toward the 0.12 level and return to long-term equilibrium. The chart below displays the weekly price action for the altcoin.
DCR-BTC (Weekly, Poloniex)
We see that the market has managed to remain above the Fibonacci support at 0.0063 and will now look to test the resistances at 0.0092 and 0.011. Also, notice that the peak of the lagging line at 0.0065 has been broken, suggesting the market is looking for a new ceiling. Finally. We anticipate a move to 0.12 over the long-term as the market returns to and tests the Ichimoku cloud. A weekly close above the base line (red), i.e., 0.008, will give further bullish confirmation.
Now that the resistance at 0.0065 has turned into support, we look to set limit buy orders just below 0.0065.
Momentum is slowly turning bullish, as the Awesome Oscillator looks to move above the zero threshold and provide another bullish signal.
AEON-BTC (Bittrex)
The weekly price action below shows that a bullish saucer has formed for AEON-BTC. A break above last week’s high at 0.00058366 should open up further gains and see the upward momentum intensify. Moreover, the peak of the lagging line (purple) lies near this level at 0.00057, and a weekly close above this level will give a bullish outlook.
Finally, another bullish signal is possible this week, with the market testing the resistance provided by the base line (red). If the weekly close si higher than the base line (red), then a strong bullish signal is given and we look for the crypto-pair to test the high at 0.000871100.
AEON-BTC (Weekly, Bittrex)
Market Snapshot
The snapshots below capture the top ten cryptoassets by market capitalization and by 24-hour volume.
Market Capitalization

Source: Coinmarketcap
24-hour Volume
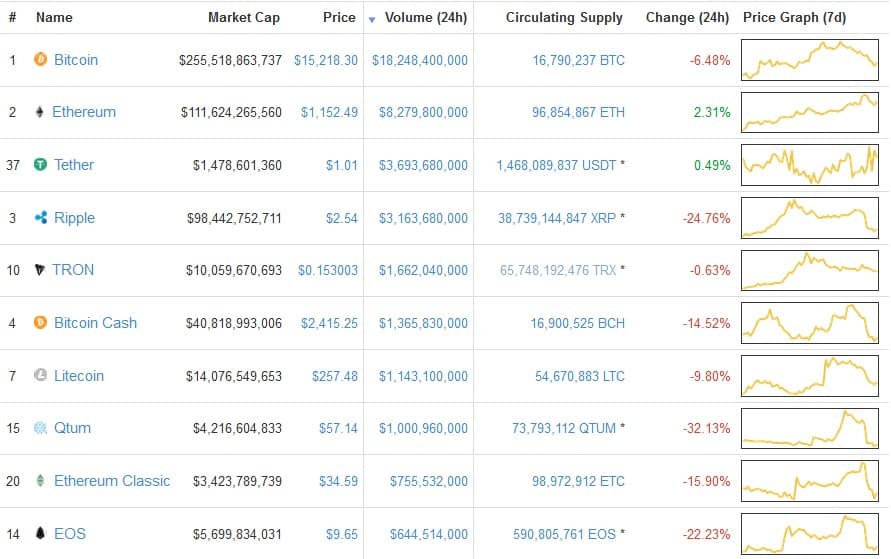
Source: Coinmarketcap
The post Cryptocurrency Market Outlook Jan. 8: Ethereum Crosses $1000 Threshold appeared first on BTCMANAGER.
Source and More information: Cryptocurrency Market Outlook Jan. 8: Ethereum Crosses $1000 Threshold
Author: BTCManager.com
Leave a Reply