

Ever since Bitcoin’s inception its trust-minimizing consensus has been enabled by its proof-of-work algorithm. The work is performed by so-called miners; power hungry machines that produce as many hashes per second as possible hoping to create a valid new blocks of transactions for the Blockchain. In return, miners that produce a valid block are rewarded with a fixed amount of coins, along with the transaction fees belonging to the processed transactions.
Nowadays, the miners in the Bitcoin network are producing a whopping 3.6 exahashes (one exahash of mining power equals a quintillion hashes) per second. This has raised many concerns over the sustainability of the protocol, as Bitcoin can only handle three or four transactions per second at best. By comparison, VISA has a peak capacity of 56,000 transactions per second, but requires nowhere near the same computational power. It’s thus quite obvious that Bitcoin must be many times more energy intensive per transaction than VISA.
The question “how much more?” is a lot harder to answer. The total network hashrate doesn’t easily translate to a certain electricity consumption, as there is no central register with all active machines (and their exact power consumption). In the past, electricity consumption estimates typically included an assumption on what machines were still active and how they were distributed, in order to arrive at a certain number of Watts consumed per Gigahash/sec (GH/s). This figure could then be used to arrive at an electricity consumption estimate, based on the observed hashrate. This arbitrary approach has led to a wide set of electricity consumption estimates that strongly deviate from one another, sometimes with a disregard to the economic consequences of the chosen parameters.
Economic Theory
One of the first papers that tried a different approach was titled “A Cost of Production Model for Bitcoin” (February 2015) written by Adam Hayes (The New School for Social Research). In his paper Hayes assesses that Bitcoin production “seems to resemble a competitive market” and therefore “miners will [in theory] produce until their marginal costs equal their marginal product”.
These marginal costs are almost entirely due to electricity costs (and some negligible variable costs). For at least the observable hashrate other costs (such as the original purchase of the mining equipment) can be ignored. Hayes also briefly explains this as “each unit of mining effort has a fixed sunk [unrecoverable] cost involved in the purchase, transportation and installation of the mining hardware. It also has a variable, or ongoing cost which is the direct expense of electricity consumption”. In other words, a miner’s decision to mine doesn’t depend on how much was paid for the equipment, just on the future (electricity) costs. (Note that this model is different when it comes to deciding whether to build/buy new mining hardware.)
Since the marginal product of mining is equal to the number of Bitcoins received per unit of mining effort, it would thus be expected that miners will either add more hashrate if the resulting revenue exceeds associated electricity costs, or reduce the hashrate once electricity costs start exceeding the revenue per hash. This also means that it is expected that the total network of Bitcoin miners is always mining at the calculate-able break-even efficiency. The break-even efficiency for Bitcoin mining can simply be calculated as:
W per GH/s*=(price∙BTC/day*)/(price per kWh ∙ 24hrday)
The resulting efficiency provides a very useful and objective indicator for miners on whether they should undertake or give up mining.
Unfortunately, the world of Bitcoin mining may be less competitive than it initially seems as a result of some serious entry barriers. For example, costs per KWh may differ strongly per region, and large scale mining operations (requiring significant startup capital) will typically outperform smaller ones due to economies of scale. Additionally, variation in the actual average costs of mining may occur due to price behavior. When the price of Bitcoin falls mining revenues are squeezed while the associated costs remain the same, causing their average costs to go up. Likewise, a (strongly) increasing price might lead to mining requiring some time to “catch up”. It, however, doesn’t change the fact that the calculate-able break-even efficiency still provides an objective upper bound on Bitcoin’s total electricity consumption. Using this number alone can already provide some powerful insights.
Increasing efficiency
To get an overview of the historic break-even efficiency, it is first required to know past revenues available to miners. Since the block rewards are known, we only need to add information about the price level. Doing so reveals that Bitcoin miners are earning far less (in total) today than they were during the peak near the end of 2013, as shown in the image below. This is partially due to a drop in the Bitcoin price, as well as the block rewards being halved in July 2016 (hence the sharp decline at this point in time).

The loss of revenue certainly hasn’t prevented Bitcoin’s hashrate from growing exponentially to its current all-time high. This is the first sign that the efficiency of Bitcoin mining must have increased dramatically over time.
If the average price of electricity was a fixed number, it would be easy to derive the break-even efficiency based on the total revenue numbers. It is, however, most likely that the average price paid by Bitcoin miners per kilowatt-hour (KWh) has decreased over time. In 2013 it was still possible to mine with a GPU at home. With the start of the age of application-specific integrated circuits (ASICs) mining, the previous started to change. Increasing startup capital was required to benefit from economies of scale, in order to be be competitive in a continually more centralized environment. These industrial scale mining operations are unlikely to be paying more than 5 cents per KWh, while residential rates may easily exceed 12 cents per KWh. For this article, it is assumed that the average price paid per KWh decreased from 12 to 5 cents per KWh during the transition period in 2014. This causes a graph of the historic break-even efficiency (up until the end of 2014) to look as follows:

This graph shows that Bitcoin mining was once perfectly profitable with a GPU miner at home, as the break-even efficiency exceeded 1,000 J/GH. The total network hashrate has increased by more than a factor 100,000 since, as shown in the first graph. It also shows how the introduction of ASIC miners has rapidly pushed the break-even mining efficiency ever closer to zero Watts per GH/s. This trend has continued over recent years (shown hereafter), albeit at a slower pace.

Increasing total electricity consumption
Along with the historic break-even mining efficiency we also get an overview for the historic upper bound on the total electricity consumption by the Bitcoin network, after combining this number with historic network hashrate.

This graph shows that the derived upper bound for Bitcoin’s electricity consumption is trending up despite the halving event in 2016. This is remarkable considering mining revenues are far from their all-time high as shown earlier. The trend can be explained considering the drop in the average price paid per KWh. As a result of mining happening on an industrial rather than on a residential scale, the revenues from mining can now pay for more kilowatts-hours than ever before.
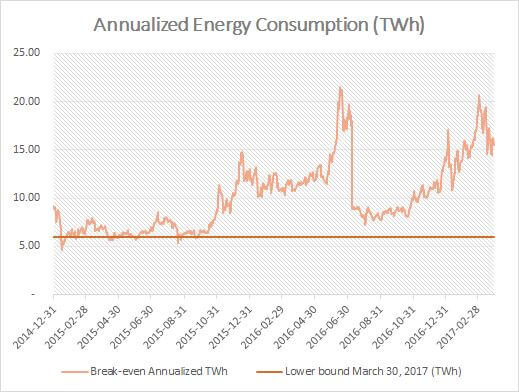
Lower bound
Economic theory is extremely useful for finding an upper bound on Bitcoin’s total electricity consumption, but it is also useful for determining a lower bound. This number is frequently determined by taking the efficiency of the best available miner and applying this to the network hashrate. Since the total network hashrate was about 3.6 exahashes per second by the end of March 2017, we would have to multiple this by 0.10 J/GH (required for the Antminer S9) to find a lower bound. We would then find an electricity consumption of almost 3 TWh per year.
This approach is obviously flawed, as it ignores many older machines that are still profitable. In reality, new machines will slowly make older ones obsolete, starting with the least efficient ones. After all, based on economic theory, they are objectively expected run for as long as their electricity costs remain below the produced revenues.
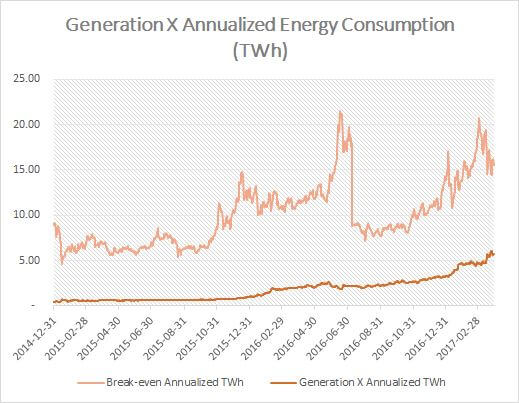
The break-even mining efficiency at the end of March 2017 was about 0,51 J/GH, so this would mean that the most efficient miners (running at 0.51 or less) introduced at the start of 2015 or before are still expected to be active today (albeit close to becoming obsolete in some cases). This generation of machines, referred to as generation “X” hereafter, can be observed over time to discover how their total electricity consumption develops.
To find a new lower bound for this generation, we can consider the development in the total network hashrate, and assume that any newly added hashrate is always made up of the most efficient machines at the moment (following the approach and numbers provided by Marc Bevand here). Economic theory adds that none of these machines is ever removed, as they didn’t become obsolete before April 2017. With this simple exercise, it can be found that by the end of March 2017 generation X is responsible for consuming roughly 6 terawatt-hours per year (around 39% of the objective break-even point).
Outlook
The previous leaves the question how much electricity the total Bitcoin network is consuming exactly. By the end of March 2017, it could be anywhere in between 6 to 16 terawatt-hours per year. The latter would mean Bitcoin’s electricity consumption equals that of Croatia, while the former would place Bitcoin closer to Mongolia. Objectively, electricity consumption should be closer to the upper bound (based on the break-even mining efficiency), as any less would indicate miners could still profit from adding more hashrate. At the very least the network should therefore be trending towards the break-even point.
Regardless of the exact electricity consumption, we have observed that this number on the rise due to miners squeezing in more kilowatt-hours in the same (and even decreasing) amount of revenue. At the same time, the price of Bitcoin is back at record-highs. As a result, the current lower bound on Bitcoin’s electricity consumption now exceeds the upper bound from the first half of 2015, despite the block reward halving in 2016. With the Bitcoin network processing 300,000 transactions per day, this means electricity consumption per single transaction equals 55 kilowatt-hours even in the most optimistic case. This is enough to power a single U.S. household for two whole days. And since a new block reward halving event is years away from now, Bitcoin isn’t likely to become more sustainable any time soon.
For a daily estimate of Bitcoin’s energy consumption make sure to visit the Bitcoin Energy Consumption Index.
Source and More information: Bitcoin Electricity Consumption: An Economic Approach
Author: Digiconomist.net
Leave a Reply