Taking a look at Bitcoin Cash, what’s most notable is the recent run that it went on against the US Dollar on February 7, when the price appreciated by approximately 25 percent. Check out the chart below in the 12-hour timeframe.
Downward Trend Remains Intact

Here’s a more ‘scrolled out’ view of Bitcoin Cash:

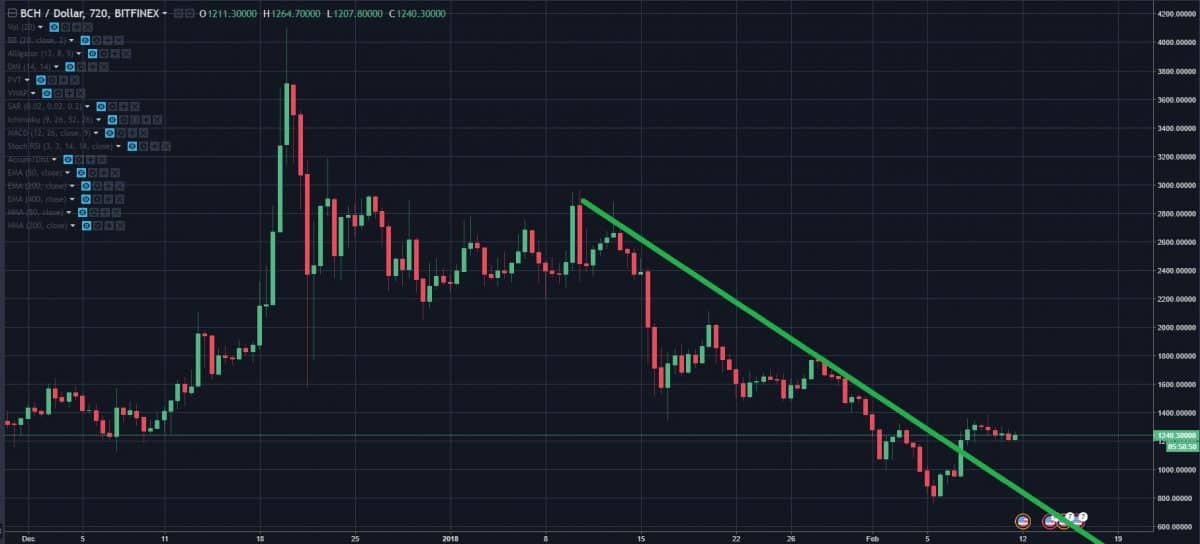
So in the two graphs above, you can see two different trendlines. We have the longer term trendline in orange, and a shorter term one in green.
Only the orange trendline is valid.
Why?
Check out the graphic below:
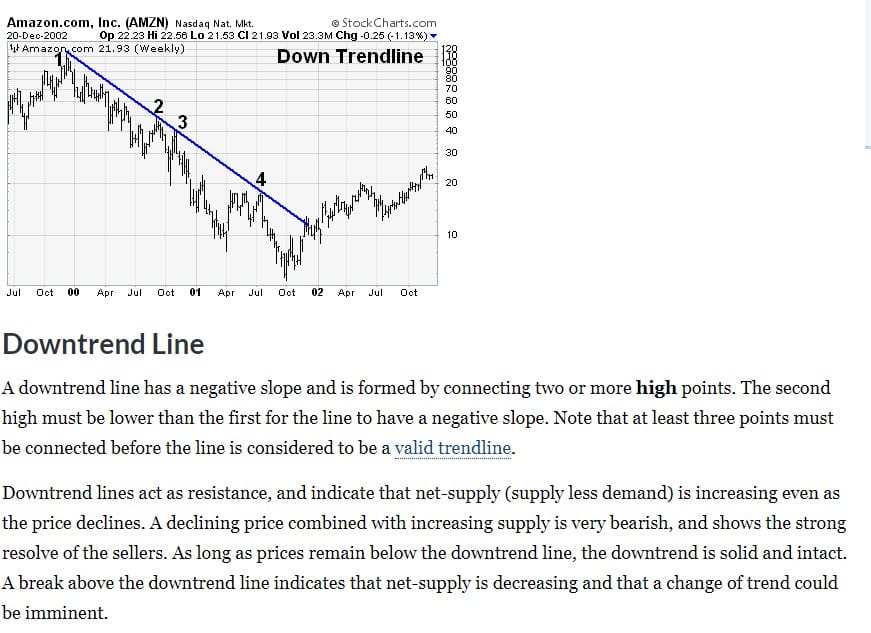
Source: http://stockcharts.com/school/doku.php?id=chart_school:chart_analysis:trend_lines
Going back to the charts that we were looking at for Bitcoin Cash:
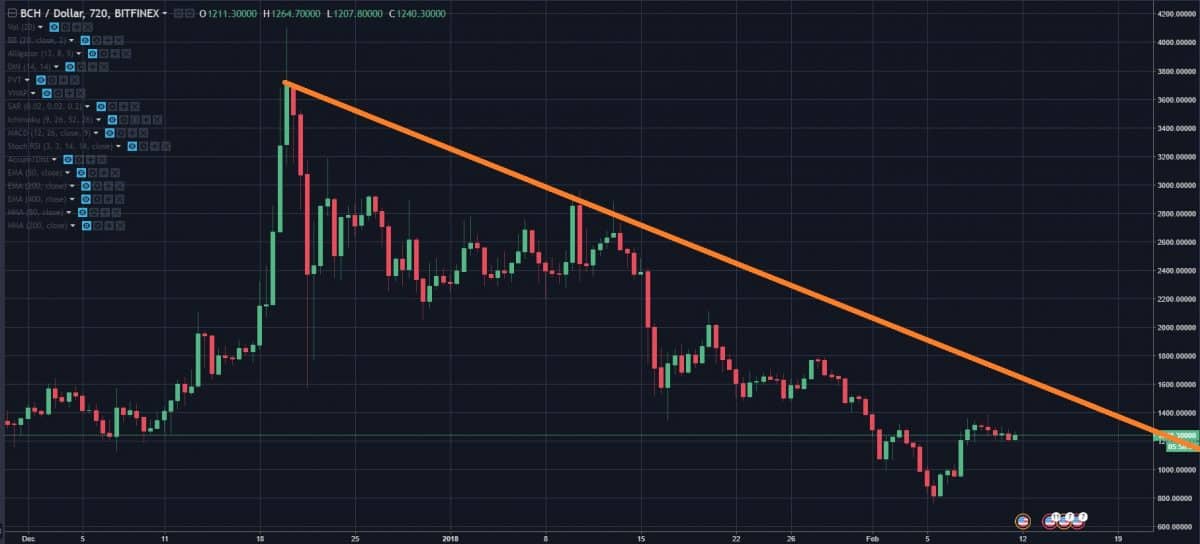
It is evident that this coin is nowhere near breaking trend right now.
So, what can we expect in the near future? The price movement over the last few periods (12-hour) will give us a better idea:
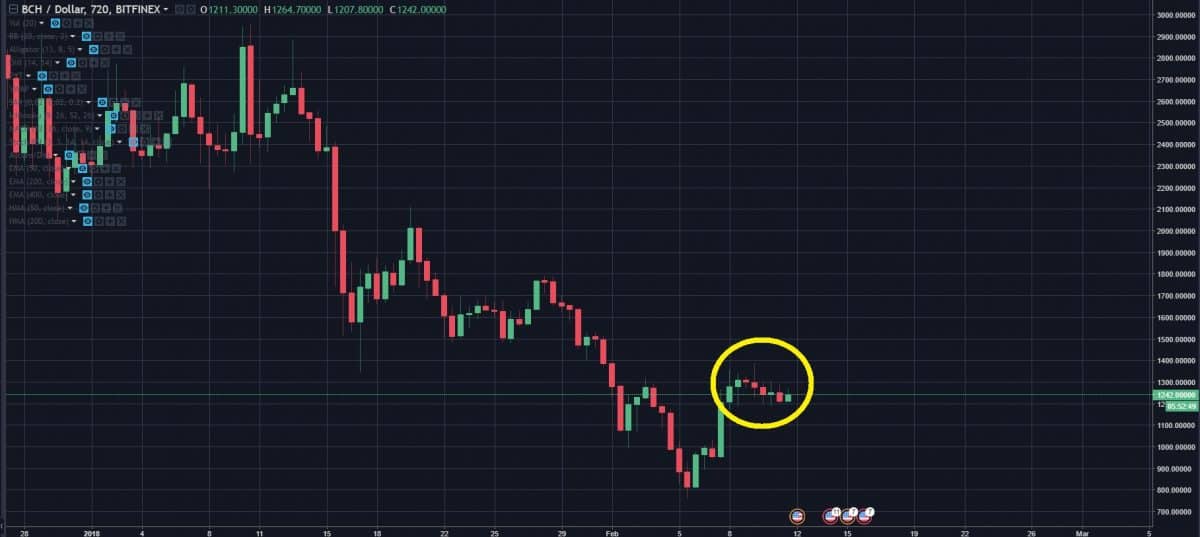
In the area that was circled here, we can see that the overall price movement for Bitcoin Cash has slowed down significantly. This phenomenon is what is referred to as consolidation.

Source: https://www.investopedia.com/ask/answers/120414/how-do-i-identify-stock-under-consolidation.asp
Given the fact that the prevailing trend is downward, I expect that the price will break downward once the volume increases for BCH. It is worth mentioning the author is still very bearish on bitcoin, which they believe will break down to $5,800-6,200 in the short/medium-term. If this does happen, then it is almost certain that most, if not all cryptocurrencies will come tumbling back down with it.
The author is very aware that the price of bitcoin has appreciated notably in the hours leading up to the curation of this report. However, the author firmly believes that this ‘bull run’ is merely a bull trap.
What is a Bull Trap?
Great question.
Check the resources out below:
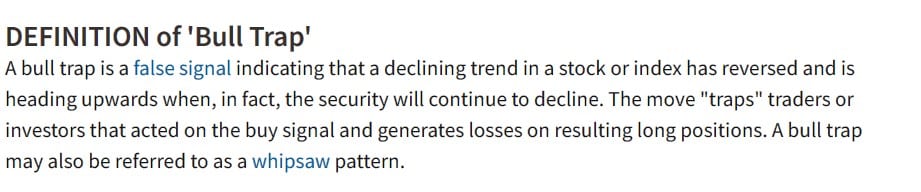
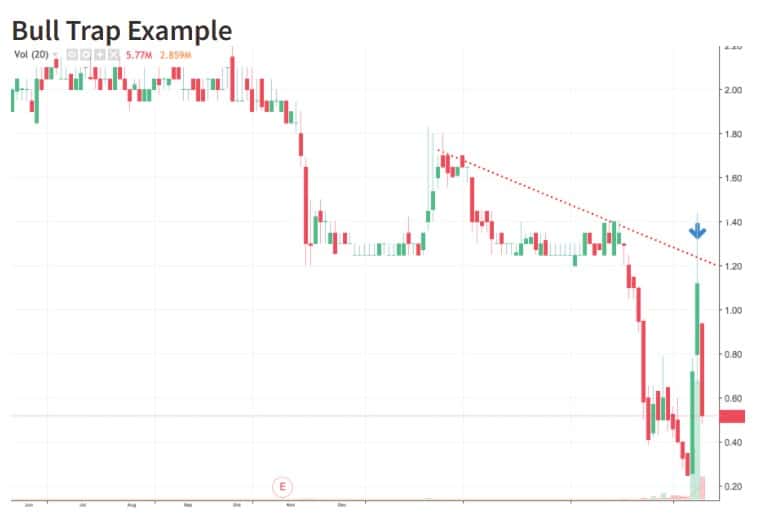
Source: https://www.investopedia.com/terms/b/bulltrap.asp
However, before we conclude our research there – let’s check out some other indicators that can give us some clues to attest to the fact that BCH-USD may be on its way down.
More Indications of a Bearish Outlook for BCH-USD
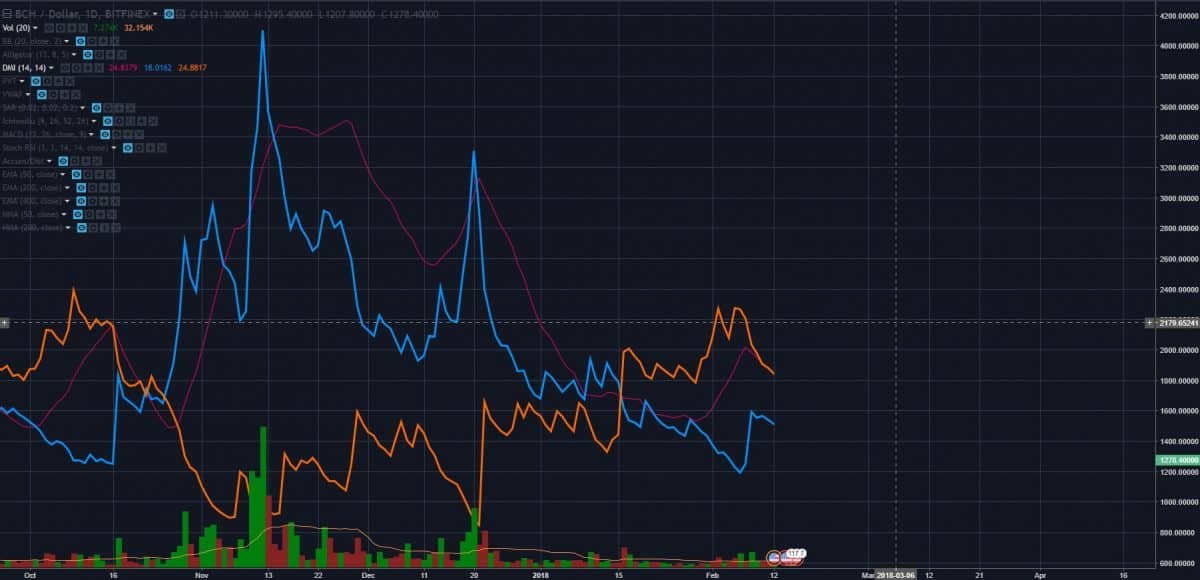
Despite a fairly substantial appreciation in the price of BCH-USD, the Directional Momentum Indicator (DMI) is still signaling bearish momentum.
For those unfamiliar with this indicator, the orange line represents selling power, and the blue line represents buying power. As you can see, both lines have trended down over the last few periods. This means that both are declining in pull. This makes sense in light of the fact that the volume has decreased significantly as well.

No signal from the Ichimoku either. The leading span A (clouds above) is still significantly above where the price is right now, meaning that it has been trending well below support for a while.
Similarly, the conversion (blue) line is well before the base (red) line. However, the conversion line is under the price itself, which is a positive sign.
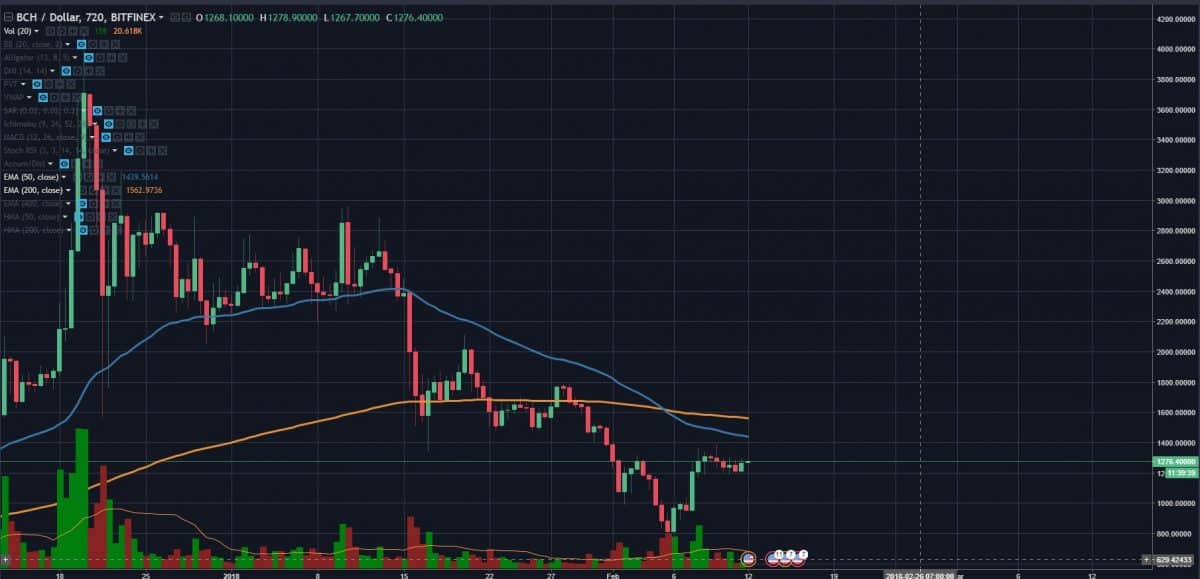
This may be perhaps the most bearish indicator out of them all.
In the picture above, you see the EMA 200 (orange line) crossing above the EMA 50 (orange line). This is what traders commonly refer to as a death cross.
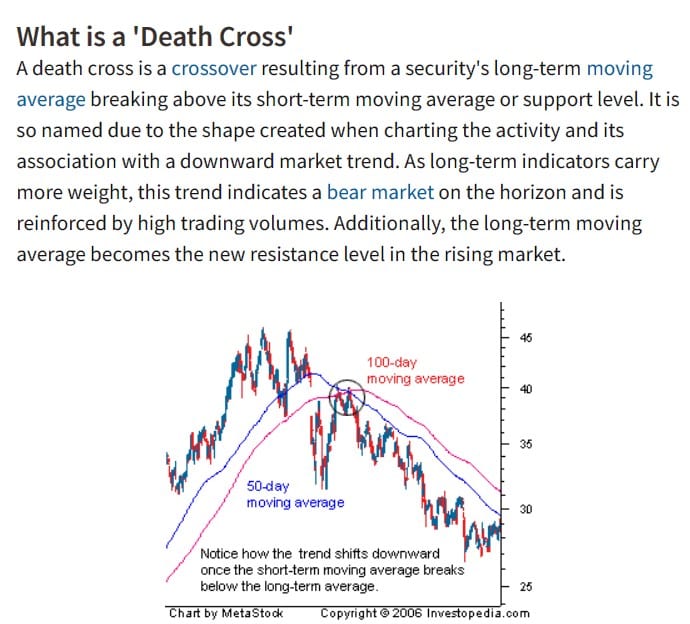
Source: https://www.investopedia.com/terms/d/deathcross.asp
Generally, the relationship between a death cross ande a sharp decrease in price is near-guaranteed. However, it often does not happen immediately, and there is some period of time that elapses before the depreciation in price does take effect.
Test of $829 Incoming?
It is also worth noting that the price itself is currently under the EMA-50 and the EMA-200 on the 12-hour chart, which is very bearish.
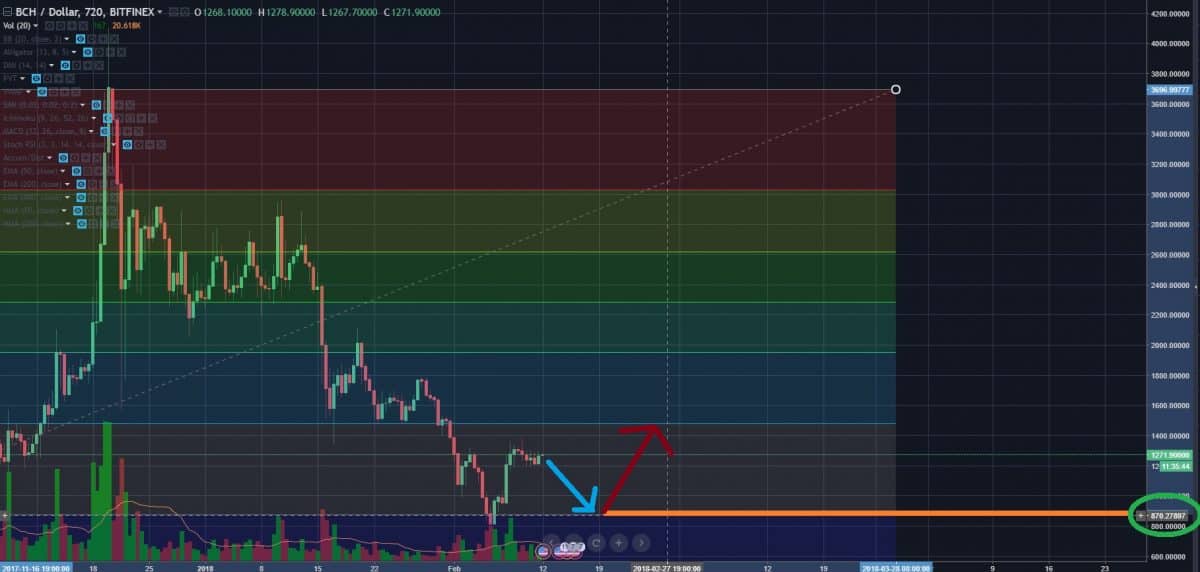
When evaluating Fibonacci levels on the chart and taking everything else that was mentioned previously into account, it seems more than likely that BCH-USD will eventually go back to retest that $829 Fibonacci level before where it found really strong support and eventually bounce back up to retest that resistance level around the $1,300 to $1,500 zone.
The post Bitcoin Cash (BCH): Price Analysis Feb. 12 appeared first on BTCMANAGER.
Source and More information: Bitcoin Cash (BCH): Price Analysis Feb. 12
Author: BTCManager.com
Leave a Reply