For those that have been monitoring bitcoin (BTC) lately, there has been a lot of talk and speculation in the last week or so about whether we’ve finally entered into the ‘bull market’ and whether the trend has reversed.
Have we Exited the Downtrend?
The author of this article is one of those individuals that believe that we have not yet exited the downtrend that BTC was in. Why is that?
See below:
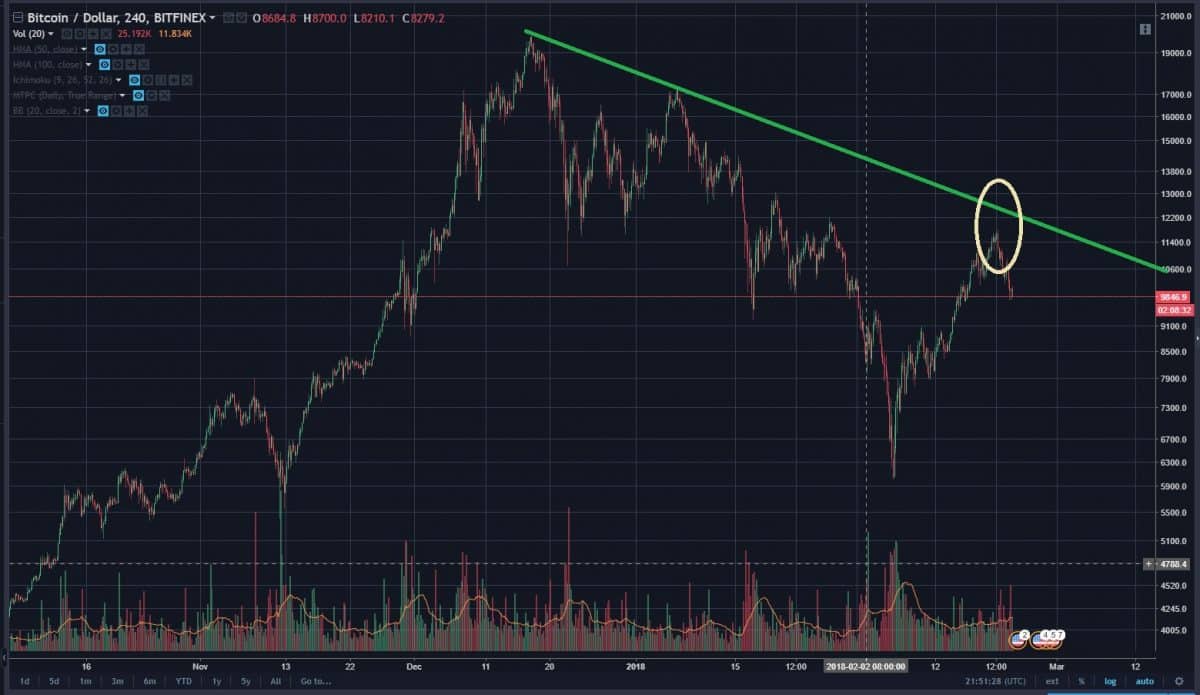
As you can see, that green line is the current ‘downtrend’ line for Bitcoin. We came close to breaching that line and thus, breaching the overall trend. However, it appears that Bitcoin was not able to do so on this run-up.
The author tried to warn individuals of the dangers of making a huge investment in a cryptocurrency/stock before it actually breaks trend – a phenomenon known as a “bull trap.”
What is a Bull Trap?

Source: https://www.investopedia.com/terms/b/bulltrap.asp
Here’s a visual of what a Bull Trap looks like:
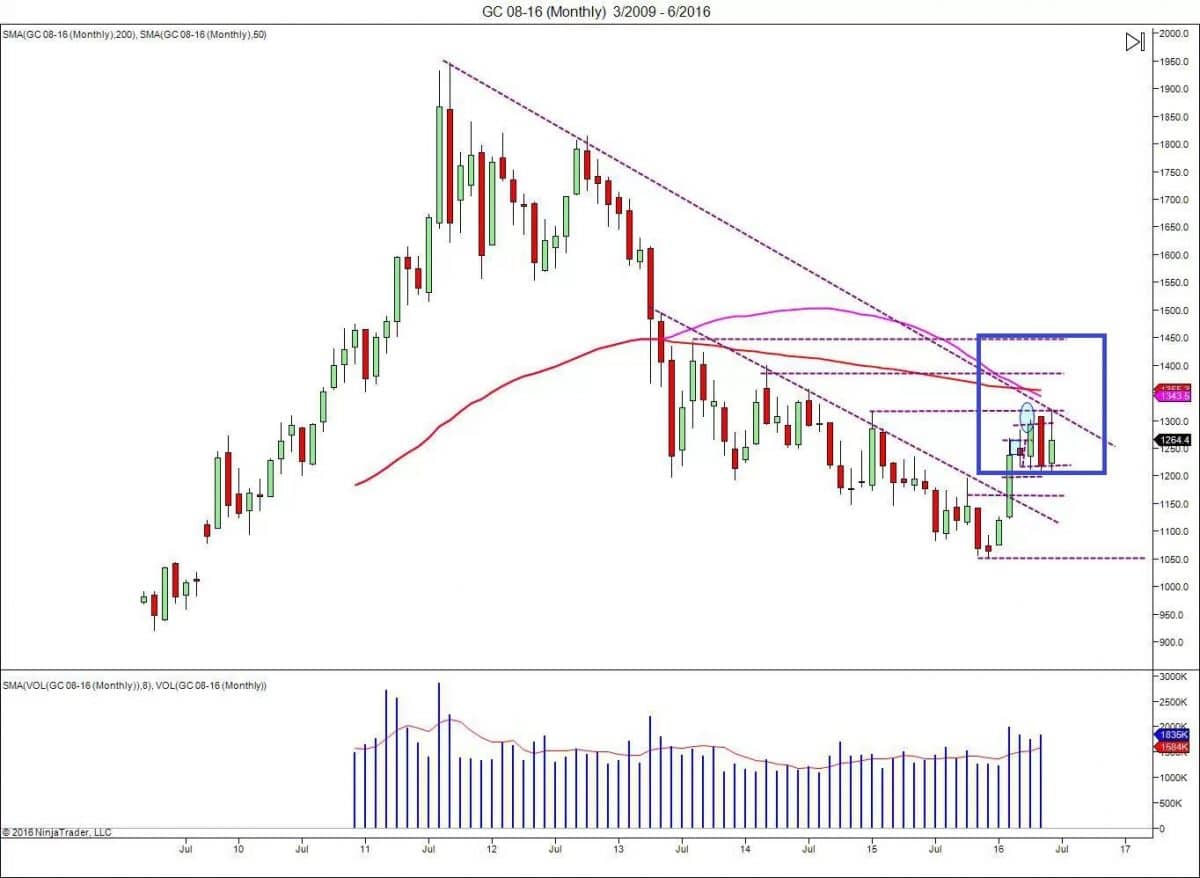
In other words, investors preemptively anticipate that a trend has been broken and they trade accordingly – which leads to serious losses when the trend does not actually break.
So What Now?
If you remember the author’s last article, there was a prediction that was made at the very bottom.

If you’re wondering about the next price movements of BTC, check this out below:
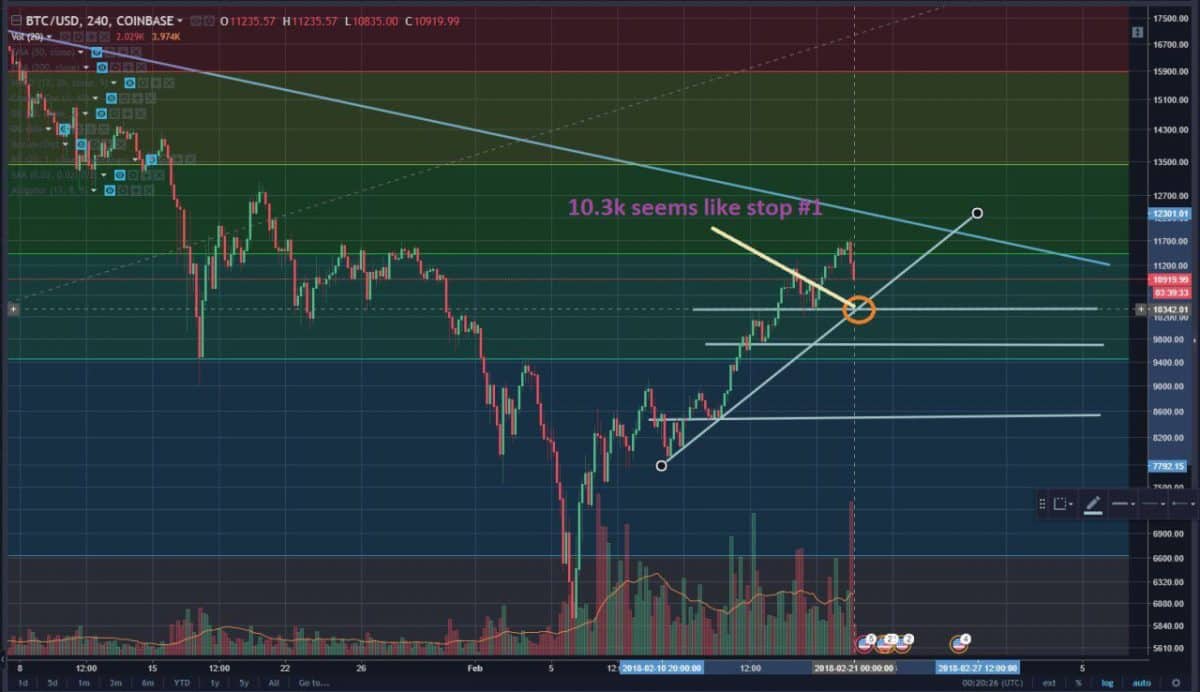
The first horizontal line on this graph represents the $10.3k mark. Based on the fact that the mini-uptrend established that vertical line for bitcoin and 10.3k was a price that bitcoin had bounced off of prior, it could be determined that $10.3k would more than likely represent a firm spot for resistance.
A drop below $10.3k means that $9.7k is the next point of resistance (second line down) and below that, one should anticipate the price making a stop in the low $8k’s.
If it breaks even further below that, then it is more than likely that the price will make one more hefty return to the $6k point to re-test. As we saw before, there is a significant amount of resistance there, and the price of bitcoin only went to that point temporarily before rocketing back up:

As many in the community have noted, a drop down to the $6k range once again (assuming support holds) would actually signify a double bottom. However, this double-bottom pattern would not be confirmed until bitcoin breaks above that $11.7k price that it was previously at. By that point, it more than likely would have already broken the downtrend that is present above it.
Let’s take a look at some technical indicators using the 12-hour time frame:
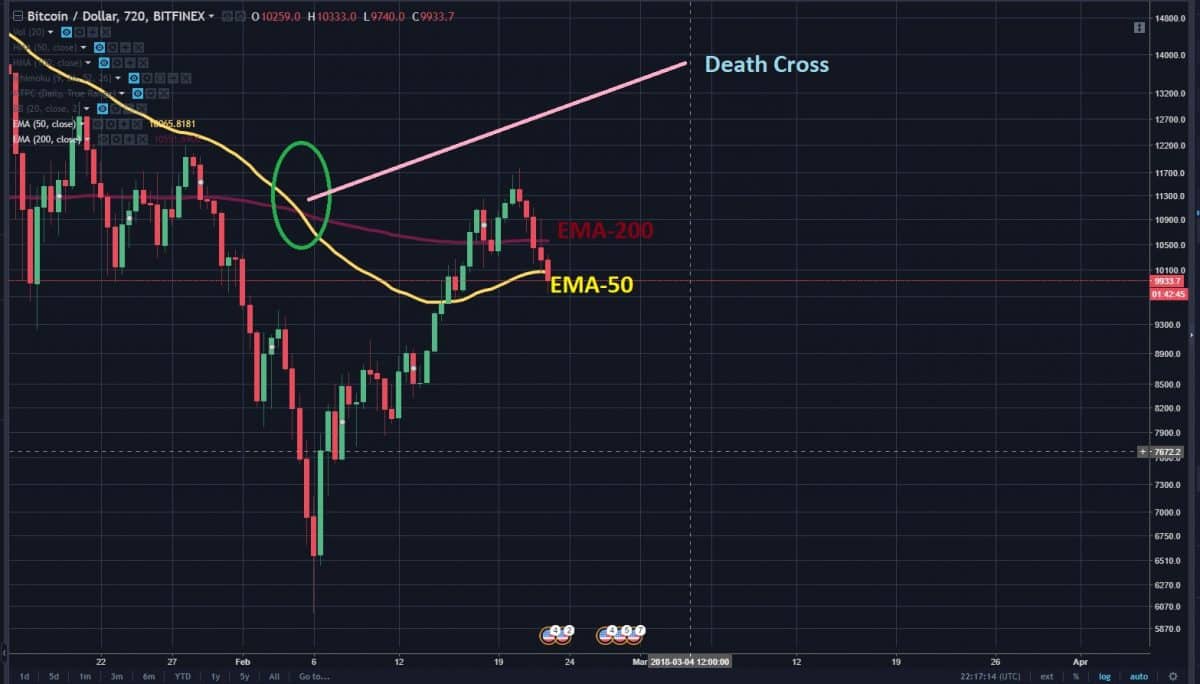
For those that are bitcoin bulls – this chart is bad news, no other way to put it.
This is the BTC/USD (Coinbase) 12-hour Time Frame that you see above. The burgundy line represents the EMA-200, and the golden line is the EMA-50.
Currently, the price is below both, which is extremely bearish and definitely not a positive sign at all. Also, the death cross (slow moving average>fast moving average) JUST happened. It looked like bitcoin was almost on its way to breaking the trend and rising in price, which would have created a golden cross signal. However, it failed to do so, and if the price continues downward, which we expect to happen at this point, then the divergence between the EMA-50 and EMA-200 will begin to increase again.
The correlation between a ‘death cross’ or a ‘golden cross’ is almost indisputable in market analysis.
To put this in perspective, the last two times that the EMA 200 was GREATER than the EMA 50 (death cross) for bitcoin on the 12-hour chart was in 2015 and 2014.
It happened twice that year. The most recent time, which was August 2015, primarily occurred because of a massive sell-off, that created this astronomical red candle:
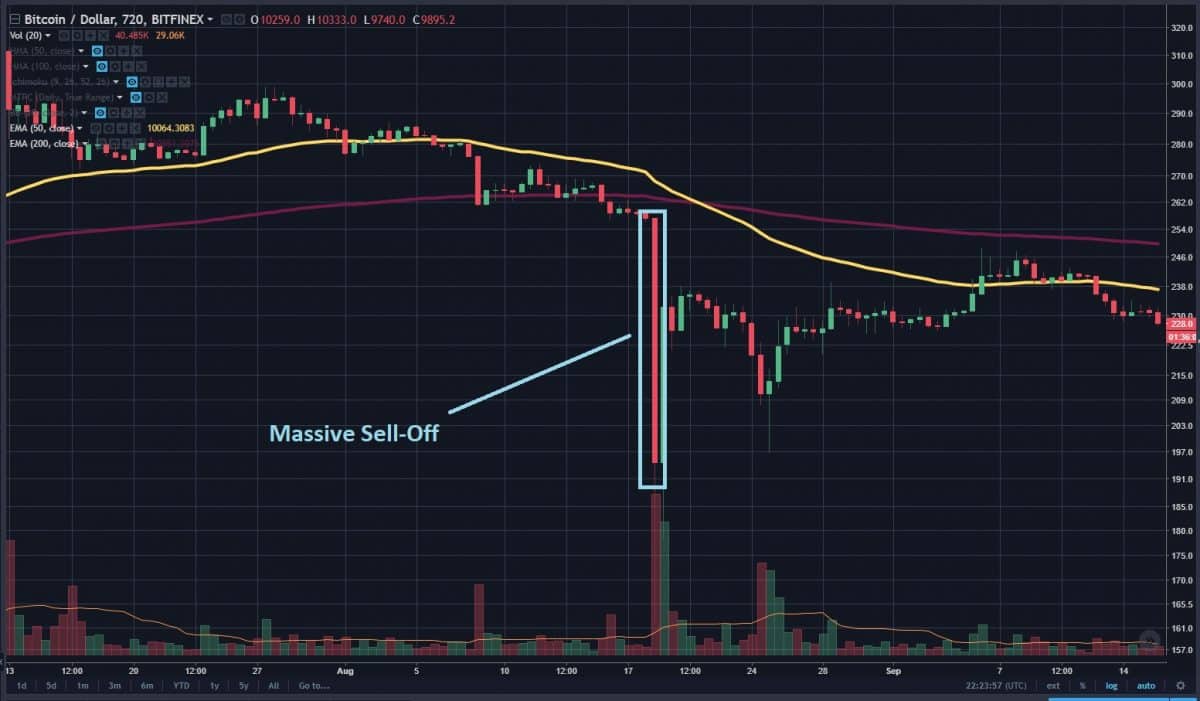
BTC-USD: August 2015
In this case, the death cross followed that massive drop in price, so that was more of a ‘false’ death cross if that makes sense.
However, the real one occurred just a year earlier in August of 2014 (same year as the Mt. Gox blow-ups).

BTC-USD: August 2014
At the time of that cross, the price was $584.
What was the low in the months following that period? $181.
That’s a near 70 percent drop.
Are You Spreading FUD?
The most recent death cross that we saw occurred at that $6k low that we outlined earlier. A 70 percent drop from that point would put the price at around approximately $2k.
Are You Really Predicting That We Might Go to $2k?
No…Well, not quite. While it is a distinct possibility, the $6k “bottom” that we experienced recently should serve as a strong benchmark.
Since the price failed to come anywhere close to breaking through that $6k barrier, this should be considered an extremely strong point of resistance for the bitcoin.
It’s also worth noting that the majority of indicators during bitcoin’s run-up were signaling that that it was massively overbought. At one point, momentum indicators were identical to where they were when Bitcoin was hovering around $20,000 in value.
So What Should We Do Now?
For those that don’t have the ability to ‘short’ the market or participate in margin/futures trading, it might not be a bad idea to consider temporarily pulling funds for the time being before incurring any stronger losses.

The volume associated with this recent sell-off is fairly high and appears to be increasing in momentum. It’s very possible that bitcoin breaks through that next resistance line that was plotted in the first graph that you witnessed way up at the top of this article and falls around the lower $8k range.
If you are attempting to trade against the trend, be careful and monitor your trades carefully!
Disclaimer: The author does not currently own any bitcoin. The author also is not a financial advisor, and thus, this article should not be considered financial advice. All content and opinions expressed within are merely opinions. Invest at your own risk.
The post Bitcoin Price Analysis Feb. 23: Bearish Trend Still in Play appeared first on BTCMANAGER.
Source and More information: Bitcoin Price Analysis Feb. 23: Bearish Trend Still in Play
Author: BTCManager.com
Leave a Reply