BTCManager’s Weekly Cryptocurrency Outlook highlights the price action and technical indicators on a long-term basis to identify the best opportunities in the largest cryptocurrencies, such as bitcoin, ether, and others.
BTC-USD (Bitstamp)
The monthly chart below shows that February’s price action managed to sustain above the base line (red), indicating momentum remains bullish over the long-term. Immediate resistance is provided by the conversion line at $10,748.00 and we look for a monthly close above this level for a stronger outlook.
February’s candlestick is displayed below and we see that the market formed a variant of the Dragonfly Doji, a reversal signal. Given that the close of the candle was higher than the base line, the likelihood that BTC-USD will continue its upward movement is high. Another buy signal is given if the market breaches the high of February’s candlestick at $11,780.00, which should open up a key resistance at $13,880.00.
The Market Facilitation Index for February’s price action displays a squat (pink), which is known as the biggest money making move. Therefore, the index is telling us that there is a high probability that buying at or around February’s close near $10,314.90 will be a highly profitable trade over the long run. The chart shows the previous squat was observed in September 2017, when bitcoin closed at $4,326.09, and then went onto reach it’s all-time high near $20,000 in the following months.
The weekly chart below shows that since closing below the base line in early February, the market has not managed to display a weekly close back above the Ichimoku indicator. For the current week, the resistance provided by the base line lies at $11,319, and the bullish outlook is emboldened if we observe a weekly close above $11,319.
The Awesome Oscillator shows no sign of the bullish saucer yet, so we could wait before going into a long position on BTC-USD. After eight consecutive weeks of red bars, we should see the oscillator change color in the upcoming weeks, and prepare a long-term buy.
A downtrend is still visible from the Renko charts on the weekly timeframe, as shown below. A break above $11,012.40 is needed to begin the formation of a green Renko candlestick (reversal signal) and a weekly close higher than $13,765.50 will confirm the Renko reversal signal and see a green candlestick painted on the chart.
The daily Renko is displayed below and shows that since February 17, no new Renko candle has formed yet. Since the sequence is green, the market is in an uptrend on this timeframe. We only look to sell once a new red Renko forms, which implies a daily close below $8,956.71. The most recent green Renko candle’s close is higher than the conversion line, suggesting momentum is beginning to turn bullish and that we should see an attempt at the base line (red).
The base line provides an indication of short-term equilibrium, and we anticipate the current uptrend to achieve this target ($12,959.66). We also see that the Awesome Oscillator has turned green in mid-February, suggesting bears are becoming weak.
Finally, the 4-hour Renko chart shows that for a downward trend to take hold, we require a 4-hour session close below $10,019.13. Moreover, we see resistance lies at $11,537.18, the high from February 20. A breakout of the Feb. 20 high would open up the extension level at $13,768.70.
ETH-USD (Kraken)
Ethereum’s ether closed in the middle third of February’s price range, suggesting indecision, but like bitcoin, closed above the short-term equilibrium as indicated by the conversion and base lines (blue and red respectively).
At the time of writing, the market is flirting with the long-term resistance at $864.83 (conversion line), and a close above this level for March’s trading session will open up the $1000 handle once again.
Similarly to bitcoin, February’s Market Facilitation Index for ETH-USD is a squat. Along with the other indicators, the squat suggests a buy near $850.00 could be very profitable over the next couple of months or so. Resistance is seen at $1105.30 and should provide an initial target for buyers.
For the weekly timeframe, the outlook again is similar to bitcoin’s; the base line (red) has held as resistance so far and the Awesome Oscillator shows no sign of momentum switching just yet. Ether’s key level to break this week is at $898.08, so a close higher than this level for the week will be considered bullish. On the other hand, a failure to close higher than $898.08 means we may see more sideways action or even an attempt at recent lows around $780.00.
The weekly Renko charts show a key balance point at $848.68; if the market moves below this level, a new red Renko will begin to form, and could point a continuation of bearish dominance. On the other hand, a break above $1060.85 will mark the beginnings of a green Renko candle. A weekly close higher than $1273.02 will be required for the green Renko to be painted on the chart.
The daily Renko chart below shows that February 14, the downward trend was reversed with the first green Renko candle. Therefore, we could look to buy ETH-USD near the close of this candle, that is, $895.29 (or on a breakout of this level).
XRP-BTC (Poloniex)
February resulted in further losses for XRP-BTC, which is nearing an important support level at 0.00008350. However, the Market Facilitation Index indicates a fake, meaning brokers in the trading pits are manipulating the price and movements are not based on fresh, incoming volume. When we see a fake, we should abstain from entering any new positions, and if you already have a position, just ignore the trading session until a go, squat or fade occurs.
From using the bullish candle from December 2017, we can obtain two important support levels where XRP-BTC will possibly start to reverse. Firstly, the 50 percent level of the candlestick lies at 0.00008350 and has, so far, held as support, with the wicks of the previous month’s candles just touching this level.
However, if the support at 0.00008350 is broken, it will open up the base level of December 2017’s candlestick; 0.00002375. Coupled with the fact that the conversion line has moved below the base line on March’s open, momentum is starting to turn bearish on the monthly timeframe, suggesting that we will see a dive toward 0.00002375.
BCH-BTC (Bitfinex)
The monthly chart for bitcoin cash shows two breakout levels. The market is currently sitting just above support at 0.11600, while resistance lies at 0.17140. A break below 0.11600 will lead to further losses and see the market head toward the December low at 0.06800.
Notice for December, the Market Facilitation Index was a fade (brown), suggesting exhaustion of buyers during this month. The following months have both displayed a fake (blue) suggesting there are no entries to be made for the month of March and we should wait for the Market Facilitation Index to change to either a go (green) or a squat (pink) in April.
The weekly price action is displayed below and shows support levels at 0.08610 and 0.06800. Notice that the lagging line (purple) has moved below the previous price action, giving us a bearish signal. The conversion line (blue) has also moved lower this week, suggesting the market will also head in the same direction. The conversion line provides resistance at 0.1593, and a weekly close lower than this level will give further bearish confirmation.
LTC-BTC (Bittrex)
Litecoin surged to its highest level since July 2015 in February’s trading session, reaching a peak of 0.0251160. Unlike bitcoin, the Awesome Oscillator for LTC-BTC is green and shows bullish momentum is in control.
February’s close also managed to push high than the resistance indicated by the lagging line (purple) at 0.0164, which gives a bullish signal for March. However, the fractal at 0.02200 was tested and rejected. We require a monthly close above 0.02200 for a move toward the extension level at 0.033742. Nevertheless, with the lagging line unrestricted and the Awesome Oscillator in the green, we should see LTC-BTC attempt the extension level and at least test 0.03000 in the next 30 days or so ahead of us.
For March, the conversion line (blue) provides support at 0.0152 and remains above the base line (red), suggesting bullish momentum is in play.
The weekly chart below shows how 0.029 is an extension level and the market should be attracted to this level. The market should find support around the horizontal conversion line, which could provide a good entry for a long position at 0.0192. However, if there is a weekly close below 0.0192, this will give our first bearish signal and see a tendency to move toward 0.0152.
The daily Renko chart shows that the outlook for litecoin is bullish. Firstly, we see that the Ichimoku cloud is starting to change color, from red to green. Secondly, we see that the next implied resistance lies at 0.02789377. Thirdly, the conversion line is moving higher and fourthly, we see a breakout of the Renko as one green Renko above the previous high at 0.01968 has been painted. Finally, the Awesome Oscillator has remained green since February 14.
NEO-BTC (Bittrex)
The monthly chart below for NEO-BTC is shown below. With many consecutive months of fakes and a large increase over December, we are inclined to think that NEO will settle down a bit more for March. Key supports lie at 0.00974224 and 0.00542486. Another important support is provided by the conversion line at 0.00840.
A failure to move above 0.0150 by the beginning of April means that a fractal resistance will form and increase the likelihood of further moves to the downside.
ADA-BTC (Bittrex)
The monthly chart for Cardano (ADA) gives little information, but it does tell us that there is a high chance that the downward move may be coming to an end. Notice, for February, the Market Facilitation Index is a fade (brown), suggesting that the preceding move is starting to lose steam.
The weekly chart also shows that the market for ADA is very close to a critical support zone. The current price sits just above the open of the bullish candlestick from the last week of December 2017. If we get a weekly close below the open of this candle, i.e., below 0.00002766, the outlook will be bearish for ADA-BTC. On the other hand, if 0.00002766 holds this week, there is a good chance we will see a reversal.
As the daily chart below illustrates, Cardano is closing on an important support BTCManager indicated in a previous weekly market outlook. A break below this level will open up support in the 1800-1500 satoshi range.
XMR-BTC (Bittrex)
The monthly chart for monero is displayed below and we see that the Awesome Oscillator has switched from red to green in color and is making higher highs, suggesting XMR-BTC could be a strong performer in March. However, the market sits just below the psychological resistance at 0.03000.
In January, the market closed above the conversion line, and should provide support going forward at 0.0244.
We look for a monthly close above 0.0300 for a test of the August 2017 high at 0.03798.
The Renko charts shows that we are seeing a fresh green Renko starting to be formed, and indicates a breakout. However, a weekly close above 0.0321675 for a new Renko to form and confirm the breakout.
Market Snapshot
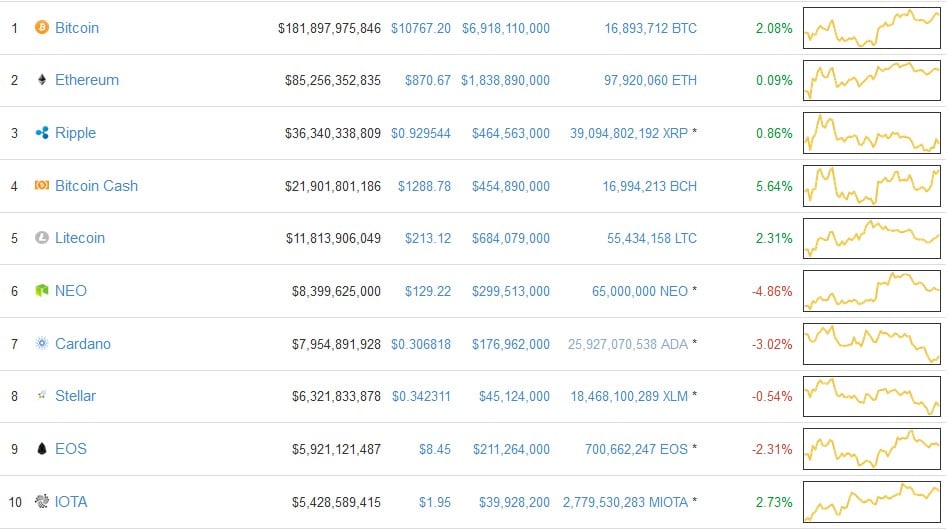
Market Cap
The top ten cryptocurrencies by market capitalization are displayed below.
24-hour Volume
The top ten cryptocurrencies by 24-hour volume are shown below.
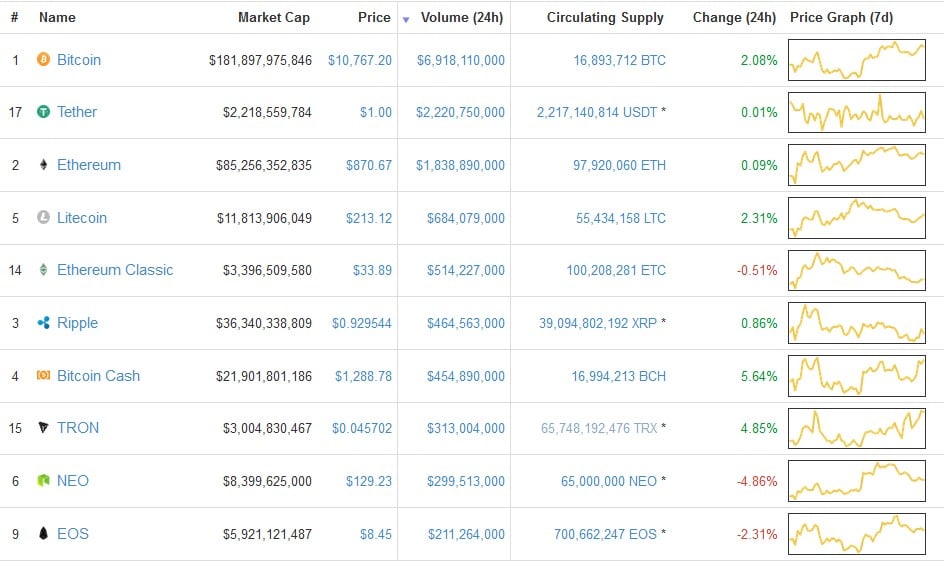
Source: Coinmarketcap
The post Cryptocurrency Market Outlook Mar. 1: Bitcoin, Ethereum, Ripple, Bitcoin Cash, Litecoin, NEO, Cardano, Monero appeared first on BTCMANAGER.
Author: BTCManager.com
Leave a Reply